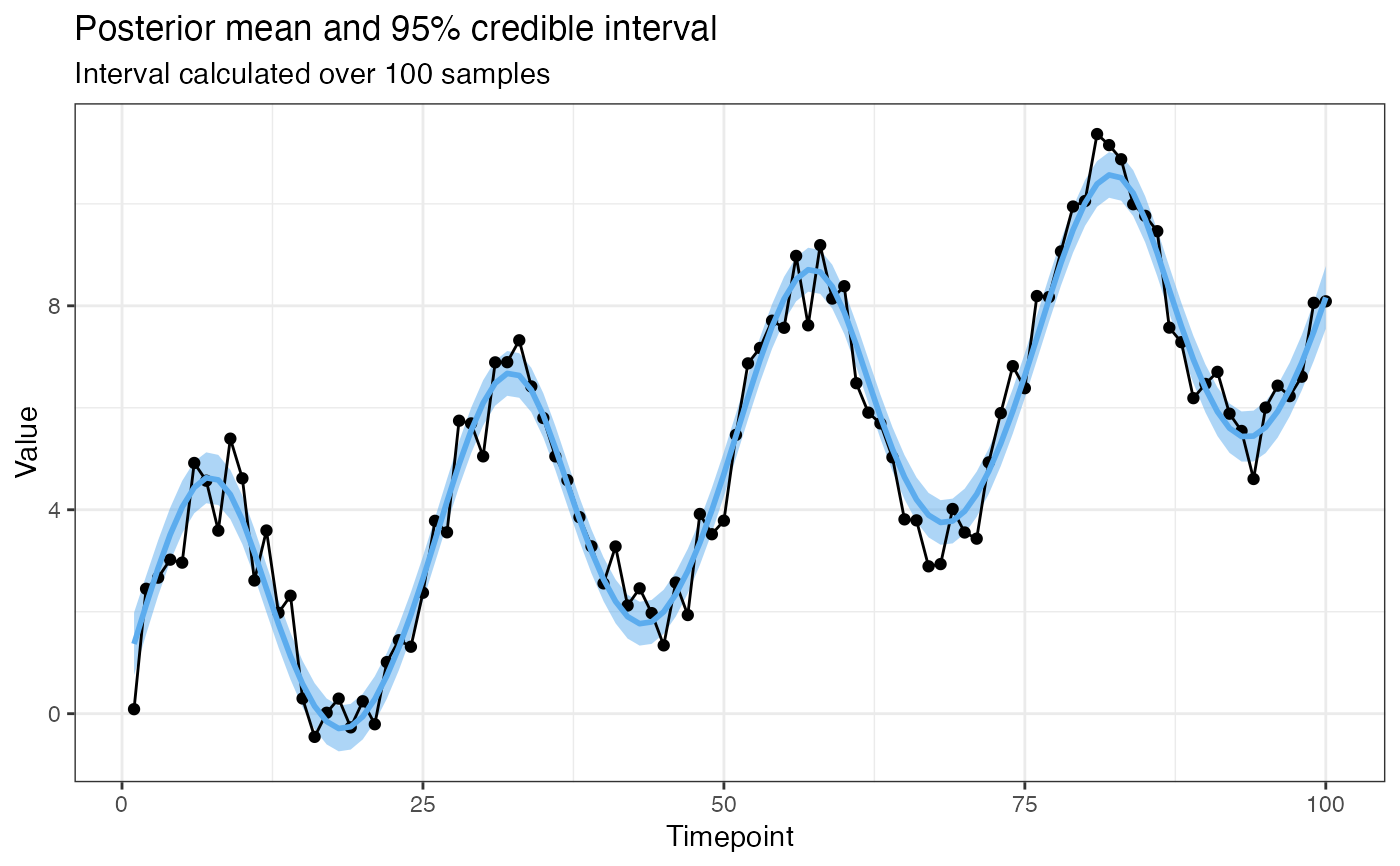
Plot summary of draws from GP posterior
Usage
# S3 method for TSGP
plot(x, prob = 0.95, draws = 100, ...)
Arguments
- x
TSGPobject containing the model- prob
numericscalar denoting the probability for the credible interval. Defaults to0.95for 95 per cent interval- draws
integerdenoting the number of draws to take from the posterior. Defaults to100- ...
arguments to be passed to methods
Examples
x1 <- 1:100

y <- 3 * sin(2 * seq(0, 4 * pi, length.out = 100)) +
  runif(100) * 2 + (0.08 * seq(from = 1, to = 100, by = 1))

CovSum <- function(xa, xb, sigma_1 = 1, sigma_2 = 1, l_1 = 1, l_2 = 1, p = 1){
  Sigma_exp_quad <- cov_exp_quad(xa, xb, sigma_1, l_1)
  Sigma_periodic <- cov_periodic(xa, xb, sigma_2, l_2, p)
  X <- Sigma_exp_quad + Sigma_periodic
  X <- structure(X, class = c("GPCov", "matrix"))
  return(X)
}

mod <- GP(x1, 1:length(y), y, CovSum, 0.8,
          sigma_1 = 5, sigma_2 = 1,
          l_1 = 75, l_2 = 1, p = 25)

plot(mod, 0.95, 100)