Plot a covariance matrix
Arguments
- x
GPCovobject containing the covariance matrix- xa
numericvector used to generatex- type
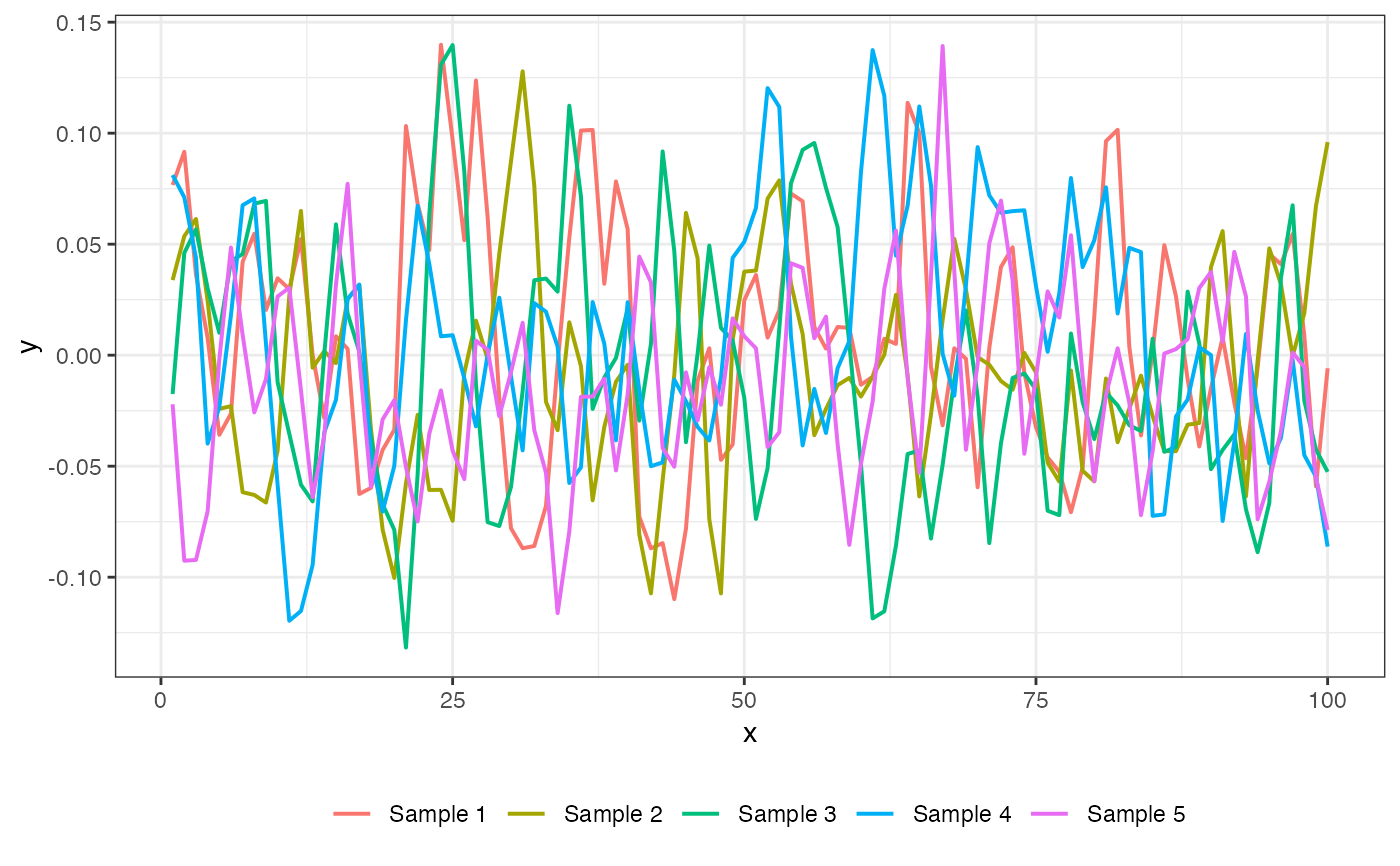
characterdenoting whether to plot samples from the GP prior ("prior") assuming a mean vector of zero, or to draw a heatmap of the covariance matrix ("matrix"). Defaults to"prior"- k
integerdenoting number of realisations to draw iftype = "prior". Defaults to5- ...
arguments to be passed to methods
Examples
x1 <- 1:100
covmat <- cov_exp_quad(x1, x1, 0.05, 1)
plot(covmat, x1, type = "prior", k = 5)