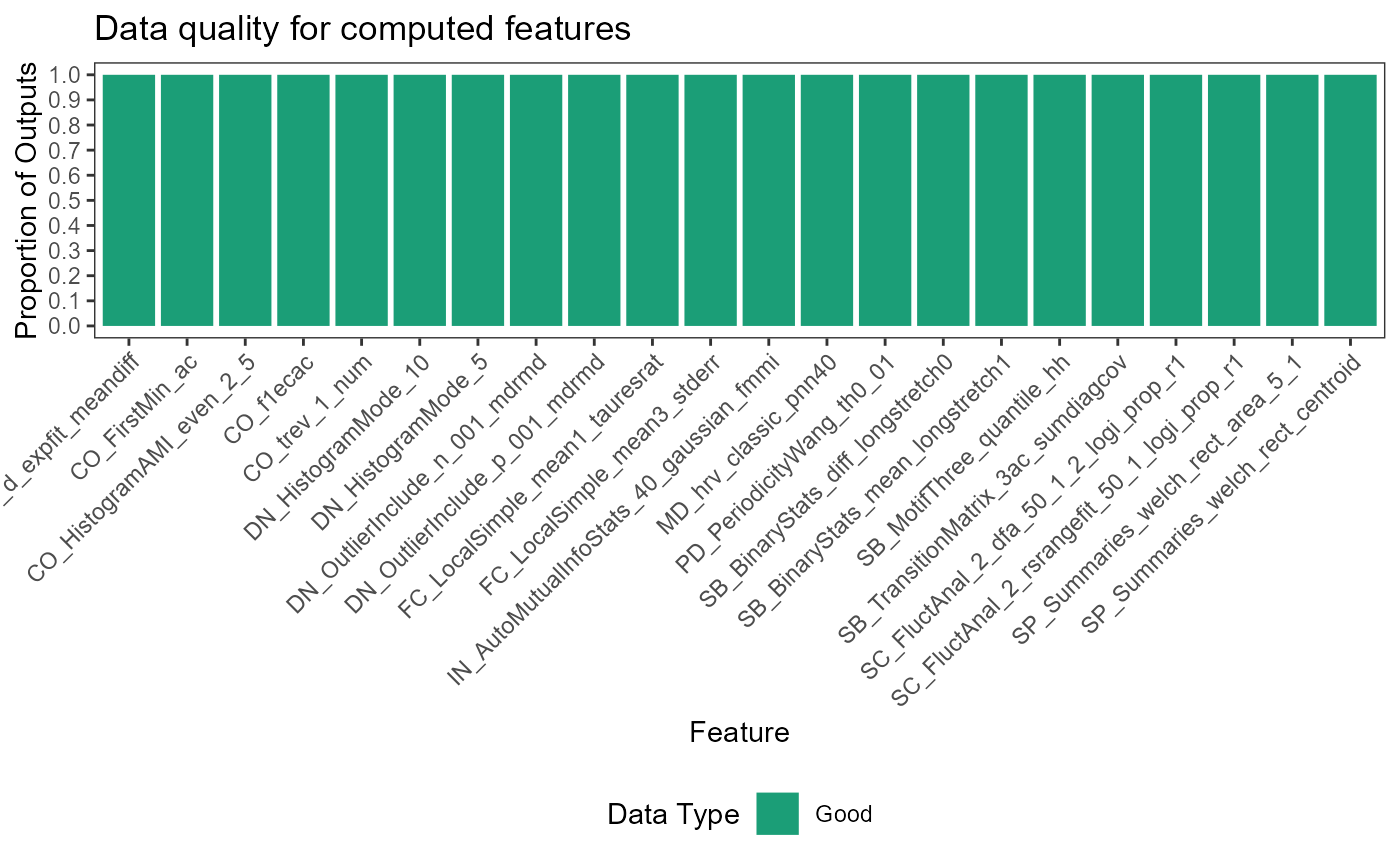
Produce a matrix visualisation of data types computed by feature calculation function.
Source:R/plot_quality_matrix.R
plot_quality_matrix.RdProduce a matrix visualisation of data types computed by feature calculation function.
Arguments
- data
a dataframe with at least 2 columns called
"names"and"values"- ignore_good_features
Boolean whether to remove "good" features (i.e., successful numeric values) from the plot. Defaults to
FALSE
Examples
featMat <- calculate_features(data = simData,
  id_var = "id",
  time_var = "timepoint",
  values_var = "values",
  group_var = "process",
  feature_set = "catch22",
  seed = 123)
#> No IDs removed. All value vectors good for feature extraction.
#> Running computations for catch22...
#>
#> Calculations completed for catch22.

plot_quality_matrix(data = featMat,
  ignore_good_features = FALSE)